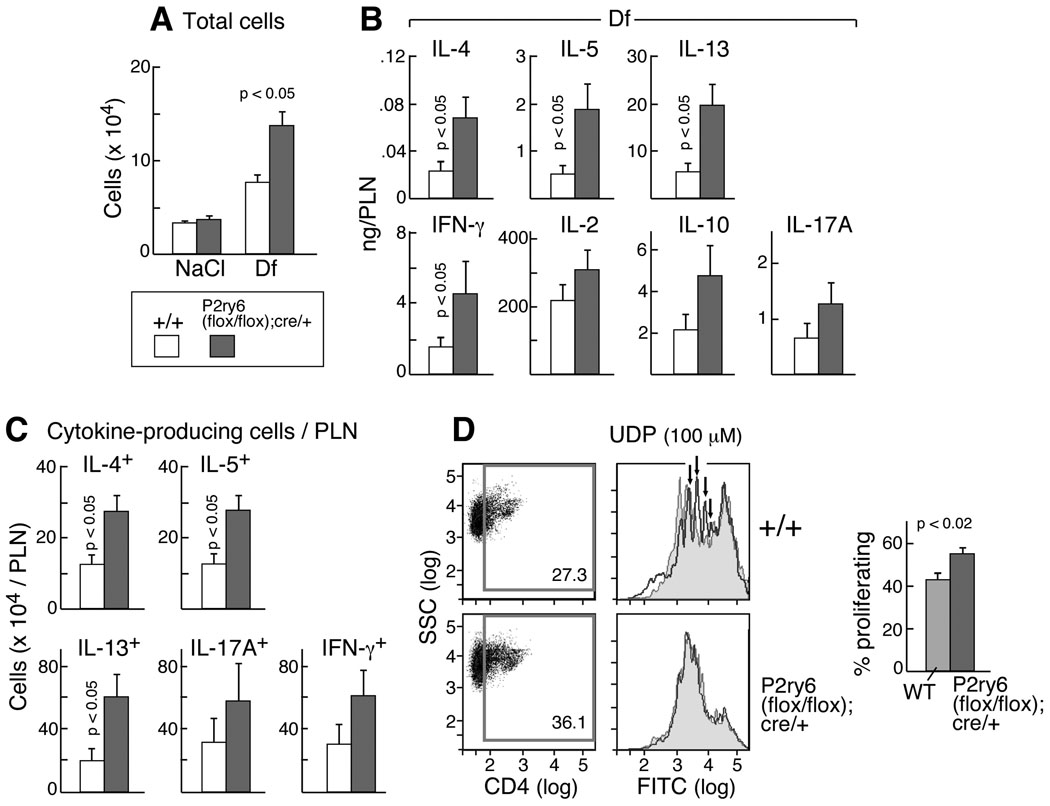
Figure 5. PLN cellularity and T cell responses.
(A) PLN cell numbers from NaCl- and Df-treated +/+ (open bars; n = 5 and 17, respectively) and p2ry6 (flox/flox);cre/+ (filled bars; n = 5 and 17) mice. (B) Cytokine release from restimulated PLN cells of Df-treated +/+ (n = 16) and p2ry6 (flox/flox); cre/+ (n = 17) mice. (C) Number of cytokine-producing cells in PLN cells of Df-treated +/+ (n = 15) and p2ry6 (flox/flox); cre/+ (n = 13) mice. Values in (A), (B), and (C) are mean ± SEM from three independent experiments. (D) Proliferation (based on CFDA-SE dilution) of CD4+-gated PLN cells from Df-treated +/+ and p2ry6 (flox/flox); cre/+ mice (N10 generation) cultured with plate-bound anti-CD3 and soluble anti-CD28 Abs. The mean ± SEM percent of proliferating cells from 5 mice/group are shown (right). Histograms showing the CFSE dilution of the CD4+ gate of polyclonally stimulated spleen cells treated with UDP (100 µM, blue) are overplayed with histograms of untreated cells (red) from the same strains in one experiment representative of two performed.

