
Figure 1.
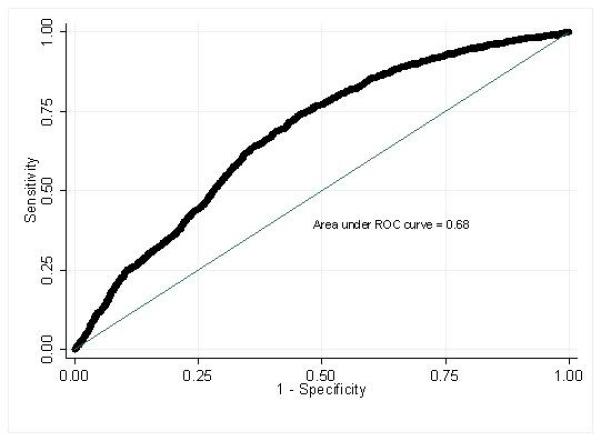
displays the generated ROC curve for birth weight difference used to predict failed VBAC; the area under the curve is 0.68.
Official websites use .gov
A
.gov website belongs to an official
government organization in the United States.
Secure .gov websites use HTTPS
A lock (
) or https:// means you've safely
connected to the .gov website. Share sensitive
information only on official, secure websites.
displays the generated ROC curve for birth weight difference used to predict failed VBAC; the area under the curve is 0.68.