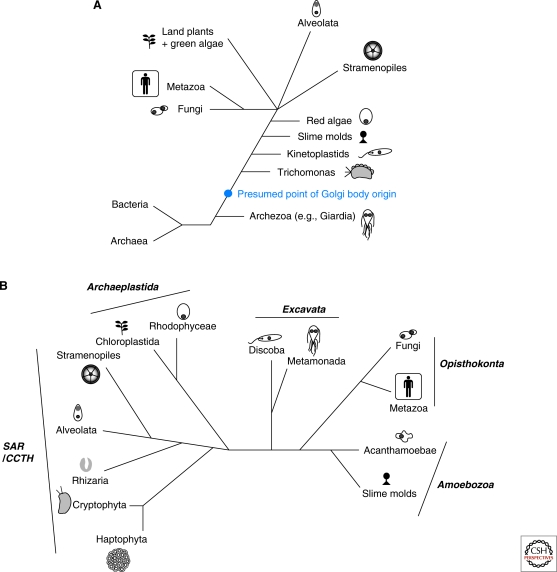
Figure 1.
Relationships of the major eukaryotic lineages. (A) The Archezoa hypothesis. This diagram, modified and redrawn from Dacks and Doolittle (2001) (reprinted with permission from Elsevier © 2001) shows some of the major eukaryotic groups sampled at the time and their proposed relationships based on phylogenetic analyses derived from ssu rDNA. The cytologically simple Archezoa, here represented by Giardia, were thought to be basal, after which the remaining lineages emerged in a ladder-like fashion culminating in a crown radiation of animals (metazoa), fungi, plants, stramenopiles, and alveolates. The deduced origin of the Golgi after the speciation of the Archezoa is shown as a blue dot. (B) The six-supergroup taxonomic scheme of eukaryotic diversity. This diagram shows the current thinking on eukaryotic relationships based on concatenated gene phylogenies and accommodating ultrastructural evidence. Because of sampling unavailable at the time of the Archezoa hypothesis, this diagram includes many more taxa. Additionally, the following organisms or lineages are now placed as follows: Giardia and Trichomonas are metamonads, kinetoplastids are discoba, red algae are rhodophyceae, land plants, and green algae are chloroplastida. The taxonomic divisions are derived from evidence described in Walker et al. (2011) among others.

