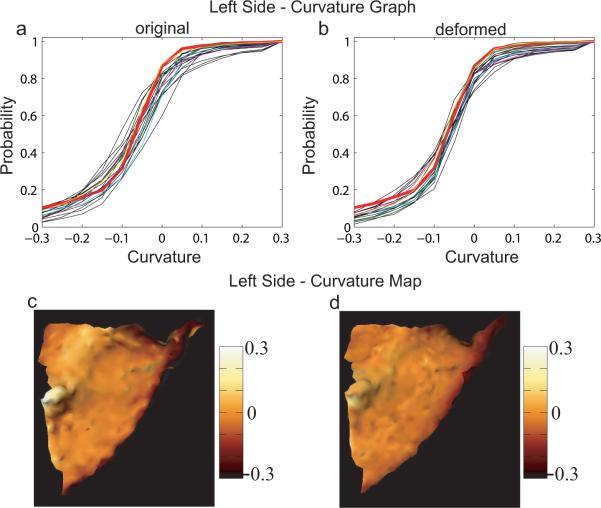
FIG. 9.
Curvature validation on the left planum temporale. Panel (a, b) show curvature graphs for left original and deformed PTs. The curvature map for the left template is marked as red in each panel. Blue, green, cyan, magenta, and yellow curves indicate the curvature graphs associated with surfaces shown in Figure 3 (a)–(e), respectively. The curvature map of the left template is shown in panel (c), while the average of curvature maps among deformed surfaces is in panel (d).

