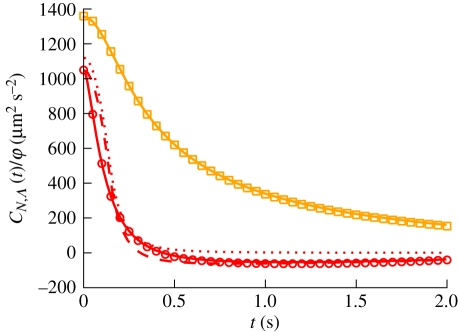
Figure 3.
Owing to the different flow topologies, the velocity autocorrelation function for dipolar swimmers (C 1) decays faster than that for the co-oriented model (2.4a) with n = 2. Solid curves indicate the exact analytical solution and symbols correspond to simulation data. Dotted and dashed curves illustrate, respectively, the long-time approximation and its behaviour in the thermodynamic limit. Parameters are those of figure 2. Red circles or solid line, dipolar model, exact; red dashed line, dipolar model, equation (3.10a); red dotted line, dipolar model, equation (3.10b); orange squares or solid line, co-oriented model, exact.

