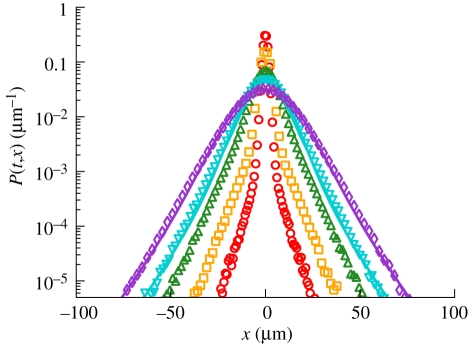
Figure 6.
Time evolution of the marginal position PDF at a volume fraction ϕ = 1.6%. Solid curves represent equation (3.15) with fitted coefficients (shown only at long times) and symbols illustrate histograms determined from simulations. Simulation parameters are those of figure 2 with D0 = 0.245 µm2 s−1. Fit parameters are α = 3/2, Dα = 0.253 µmα s−1, and K = 0.0825 µm−1. Red circles, t = 1 s; orange squares, t = 5 s; green triangles, t = 25 s; cyan inverted triangles or solid line, t = 50 s; purple diamonds or solid line, t = 100 s. At intermediate times t ≃ 1 s, our data resemble the measurements from Leptos et al. [6].

