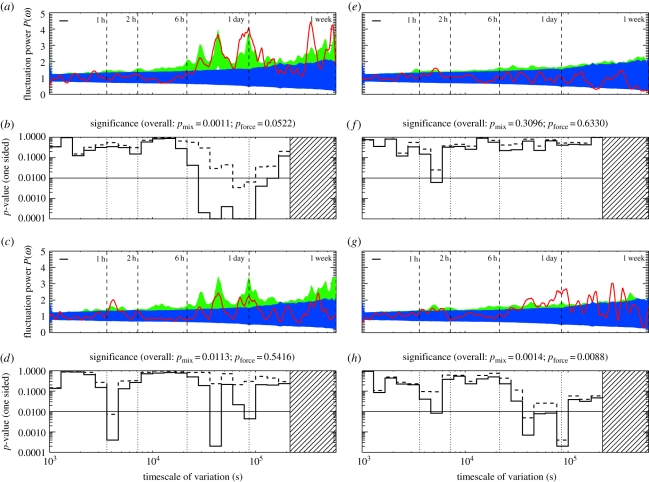
Figure 2.
Demographic classes defined by sex and age show different timescales. (a,b) Periodogram and p-values, for the subadult females (n = 11). (c,d) Adult females (n = 22). (e,f) The subadult males (n = 6). (g,h) The adult males (n = 8). As before, the periodogram data are shown in red, and the blue band shows the p = 0.05 confidence for the mixed-strategy null of §4.1; the green band shows the p = 0.05 confidence for the daily-forcing null of §4.2. The p-values are one-sided, and for the mixed- (solid line) and daily-forcing (dashed line) nulls discussed in the text. (Online verison in colour.)

