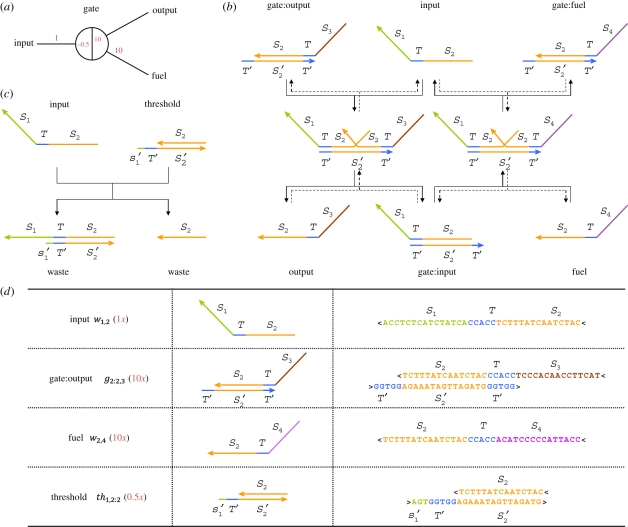
Figure 1.
The DNA motif for ‘seesaw’ gates. (a) Abstract gate diagram. Red numbers indicate initial concentrations. (b) The DNA gate motif and reaction mechanism. S1, S2, S3 and S4 are the recognition domains; T is the toehold domain; T′ is the Watson–Crick complement of T, etc. Arrowheads mark the 3′ ends of strands. Signal strands are named by their domains from 3′ to 5′, i.e. from left to right, so the input is S1TS2; gate base strands and threshold bottom strands are named by their domain from 5′ to 3′. All reactions are reversible and unbiased; solid lines indicate the dominant flows for the initial concentrations shown in (a), while the reverse reactions are dotted. (c) The threshold motif and reaction mechanism. The toehold is extended by a few bases (s′1, the complement of the first few 5′ bases of S1), providing an increased rate constant relative to the gate itself. Branch migration intermediate states are omitted from the diagram. (d) Example sequences. Gate complexes and signal molecules are shown at the domain level (second column) and at the sequence level (third column). Here, recognition domain sequences are 15 nt, the toehold domain sequence is 5 nt, and the toehold is extended by 3 nt for the threshold. Other lengths are possible, so long as they ensure that recognition domains will not spontaneously dissociate, toehold exchange is fast, and thresholding is sufficiently faster.

