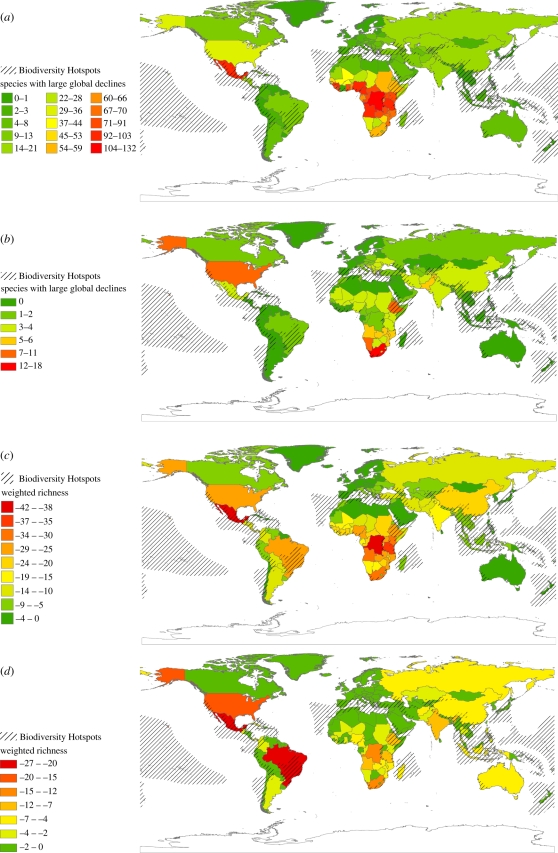
Figure 1.
Global patterns of projected mammal loss in relation to global Biodiversity Hotspots [21] (hatched). (a) Worst-case outcome for number of mammal species in each country with large projected global declines (losing at least 30% of suitable habitat globally by 2050 in any Millennium Ecosystem Assessment scenario). (b) Best-case outcome for number of mammal species in each country with large projected global declines (losing at least 30% of suitable habitat globally by 2050 in all four Millennium Ecosystem Assessment scenarios). (c) Mammal richness weighted by average global loss (GL) across the four scenarios. (d) Mammal richness weighted by average national contribution to global loss (NCGL) across the four scenarios. Legend categories use natural breaks adjusted to the closest integer with ArcGis 10 [22].

