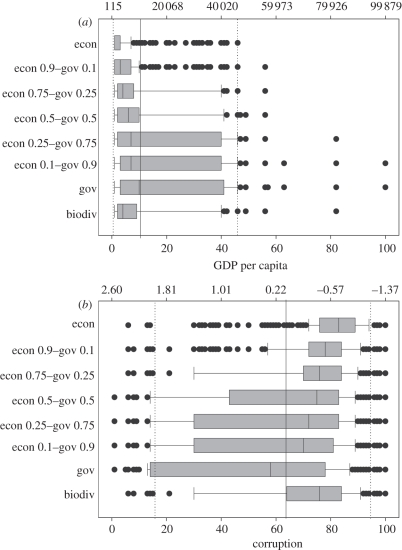
Figure 2.
Distribution of GDP values (a) and governance scores (b) for all cells in top 10% fractions achieved with each of the eight scenarios. Mean and 95th percentiles across all nations in the dataset are shown as reference (solid line and dashed line, respectively). The units on x-axes are given both as the scaled values used in our calculations (below) and as the original GDP and Control of Corruption indicator values (above the panels).

