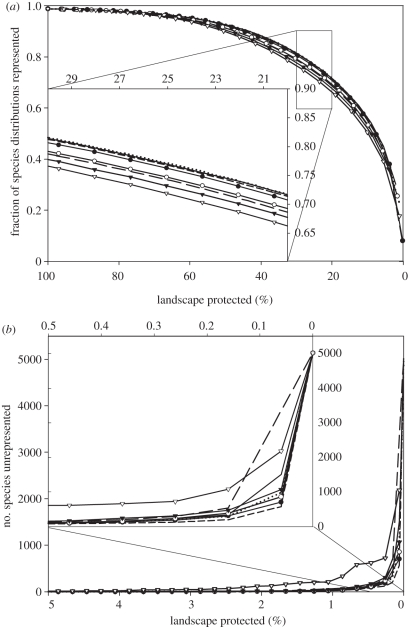
Figure 3.
Species representation in all eight scenarios. (a) Mean proportion of species' distributions remaining protected at decreasing fractions of area protected. (b) number of species entirely unprotected at decreasing fractions of area protected. Note that the insets show a magnification corresponding to a particular range of percentage of landscape protected, between 20–30% for (a) and 0–0.5% in (b) (see the range of values on top of the inset). Dashed line, biodiversity only; long dashed line, governance only; solid line, economic 0.1–governance 0.9; dotted line, economic 0.25–governance 0.75; solid line with filled circles, economic 0.5–governance 0.5; solid line with open circles, economic 0.75–governance 0.25; solid line with filled inverted triangles, economic 0.9–governance 0.1; solid line with open inverted triangles, economic cost only.

