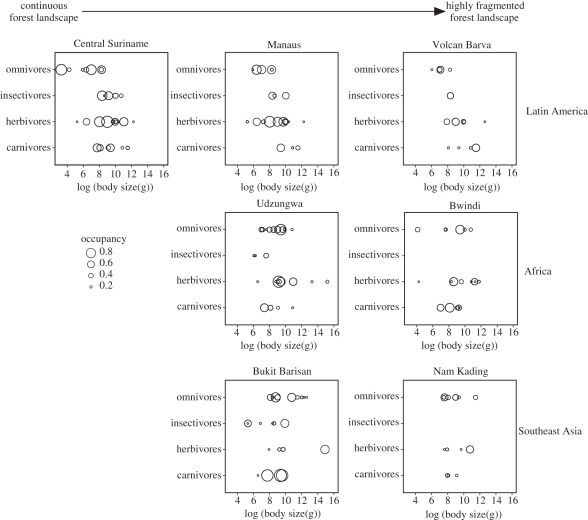
Figure 4.
Forest mammal community structure for all seven sites. Sites are arranged by continent (rows) and surrounding landscape structure (columns). Individual figures show the distribution of species along two functional traits: body size (expressed in a log scale) and trophic category. Each circle in the figure represents a species in functional space, with the size of the circle proportional to the estimated occupancy.

