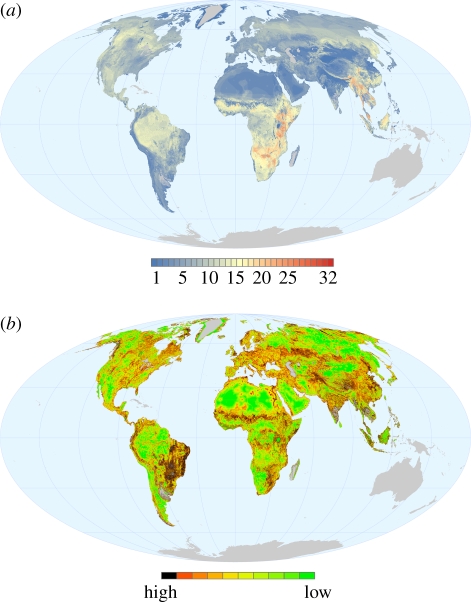
Figure 2.
(a) Species richness of the world's terrestrial mammalian carnivores (n = 246) based on the extent of suitable habitat. Blue denotes sites with few carnivore species, and red denotes sites with the highest species richness. (b) Global hotspots of fragmentation and core habitat, standardized by species richness. Green denotes sites with low fragmentation, where carnivores, averaged across species with suitable habitat at a site, have the most intact high-quality core habitat. Black denotes sites with high fragmentation, where carnivore species on average have relatively little core habitat.

