Figure 6.

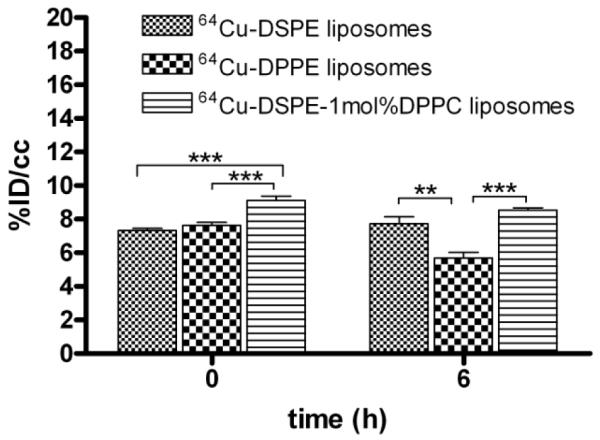
Quantitative analysis (%ID/cc) of PET images of kidney. Statistical analysis was performed by ANOVA, followed by Tukey’s multiple comparison test (error bars, mean ± STD; *, P < 0.05; **, P < 0.01; ***, P < 0.001)

Quantitative analysis (%ID/cc) of PET images of kidney. Statistical analysis was performed by ANOVA, followed by Tukey’s multiple comparison test (error bars, mean ± STD; *, P < 0.05; **, P < 0.01; ***, P < 0.001)