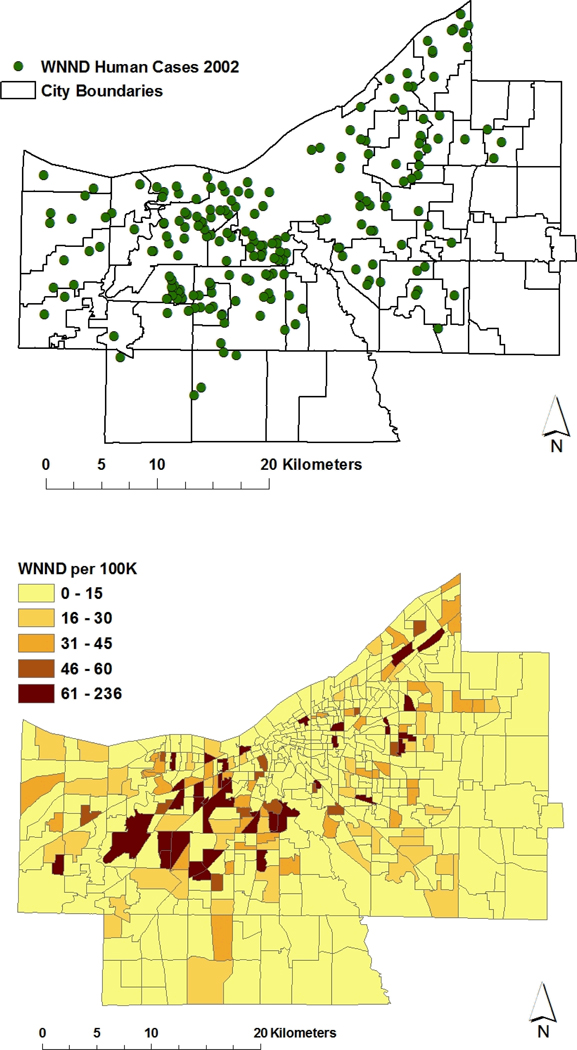
Figure 1.
Upper panel, distribution of severe human WNV-associated neurological disease (WNND) cases by residence location in Cuyahoga County, 2002. For this map, black outlines indicate boundaries of individual cities and municipal townships included within the county limits; Lower panel, local age-adjusted attack rates for WNND within established US Government census tracts of Cuyahoga County. Increased age-adjusted risk is indicated by darker shades of color. For the county at-large, the 2002 rate of WNND was 16 per 100,000 population.

