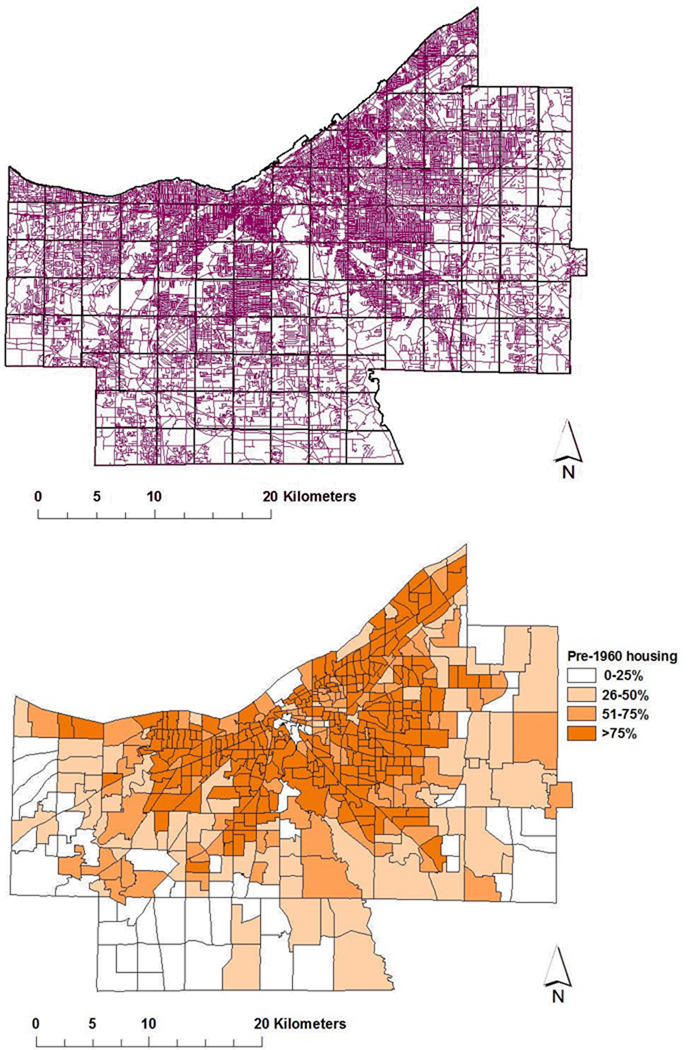
Figure 4.
Examples of GIS data inputs for risk modeling. Upper panel, All Cuyahoga County roads in purple, with analytic quadrat grid overlaid in black; Lower panel, location of older housing stock as determined by census tract for year 2000 US census data on age of individual domiciliary structures.

