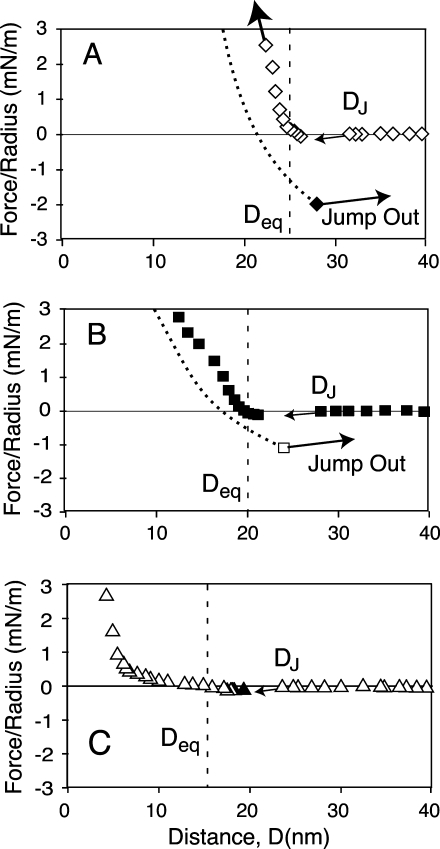
Figure 3.
Details of advancing, normalized force curves and adhesion measured with the different DC-SIGNR variants. The glycolipid ligand was present at 5 mol %, and separation curves were measured after 8 min of contact. (A) Force–distance profile measured with the 7-repeat variant. Open diamonds were measured during approach, and the filled diamond shows the location and magnitude of the pull-off force at DAdh. (B) Force profile measured with the 6-repeat form of DC-SIGNR. Filled squares indicate forces during approach, and the open square shows the position and magnitude of the pull-off force. (C) Force profile measured with the 5-repeat form of DC-SIGNR. The open triangles were measured during approach and the black triangle shows the force at DAdh. The vertical, dashed lines show the positions of Deq in each case.

