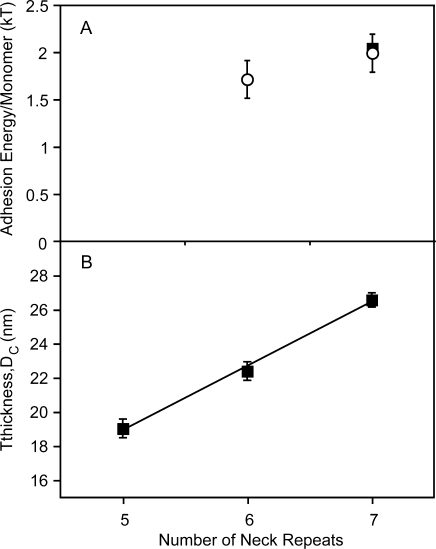
Figure 4.
Dependence of DC-SIGNR and DC-SIGN thickness and adhesion on the number of neck repeats. (A) Population-averaged adhesion energy per monomer as a function of the number of neck repeats in DC-SIGNR. The open circles indicate the adhesion energy per DC-SIGNR monomer and the black square represents the adhesion energy per DC-SIGN monomer, measured after 8 min of contact with the ligand surface. Adhesion data are from Table 2. (B) Thickness of the DC-SIGNR–glycan complex as a function of the number of neck repeats in DC-SIGNR. Least-squares analysis of the data from Table 1 (N = 23) yields a slope of 3.87 ± 0.23 nm/repeat.

