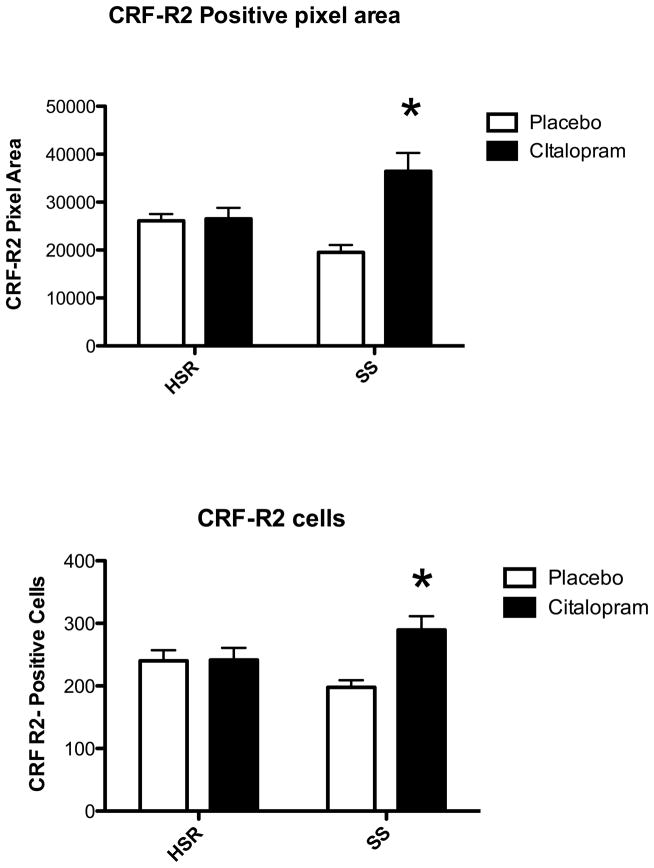
Figure 12.
Top. Average CRF-R2-positive pixels across 5 levels of the dorsal raphe in all groups. There was no effect of stress sensitivity (p=0.50), but there was a significant effect of citalopram treatment (p=0.004) and a significant interaction. (p=0.0058). The SS+CIT group exhibited significantly higher CRF-R2 positive pixels compared to the other groups. Asterisk represents a significant difference (Bonferonni, p<0.05). Bottom. Average number of CRF-R2-positive cells across 5 levels of the dorsal raphe in all groups. There was no effect of stress sensitivity (p=0.87), but there was a significant effect of citalopram treatment (p=0.023) and a significant interaction. (p=0.0259). The SS+CIT group exhibited significantly higher CRF-R2 positive pixels compared to the other groups. Asterisk represents a significant difference (Bonferonni, p<0.05).

