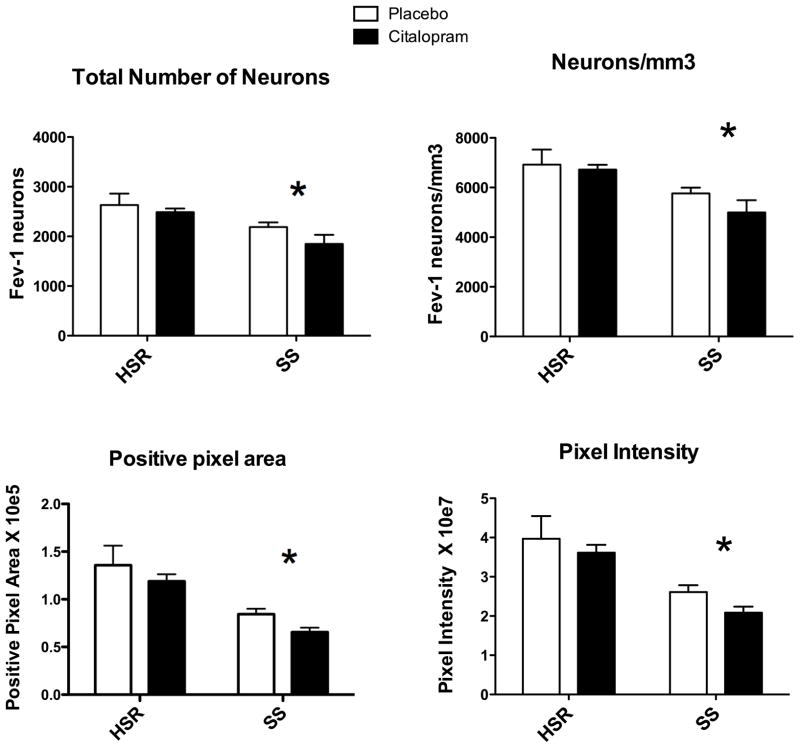
Figure 3.
Overall average of several Fev parameters for each group (n=3–4/group). From (Lima et al., 2009)
Top Left - The number of neurons in each level was summed generating the total number of neurons per animal. The mean of the total number of neurons for each group is illustrated. There was a significant effect of stress sensitivity (*p = 0.008), but no effect of treatment (p= 0.18) and no interaction (p=0.57).
Top Right - The number of Fev positive serotonin neurons per mm3 volume is illustrated. There was a significant effect of stress sensitivity (*p = 0.008), but no effect of treatment (p= 0.31) and no interaction (p=0.54).
Bottom Left - The average positive pixel area is illustrated. There was a significant effect of stress sensitivity (*p = 0.001), but no effect of treatment (p= 0.167) and no interaction (p=0.938).
Bottom Right - The intensity of each positive pixel was obtained and summed for each level. The average of the summed pixel intensity across all 8 levels was obtained for each animal and this was used to obtain the group means of positive pixel intensity as illustrated. There was a significant effect of stress sensitivity (*p = 0.002), but no effect of treatment (p= 0.23) and no interaction (p=0.81).

