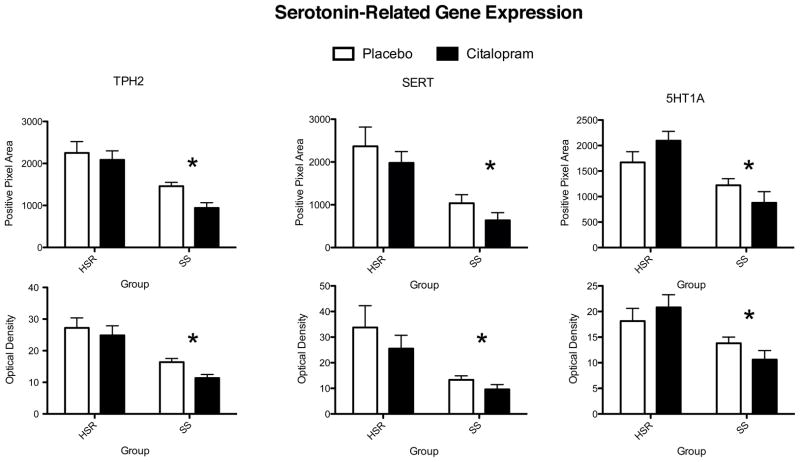
Figure 7.
Histograms illustrating the average positive pixels and optical density of TPH2, SERT and 5HT1A signal in the dorsal raphe nucleus of HSR and SS macaques treated with placebo or citalopram for 15 weeks. For all genes, there was a significant effect of stress sensitivity on optical density and on positive pixel area. However, there was no effect of drug treatment on optical density or on positive pixel area and there was no interaction. From (Lima et al., 2009).
| Stress Sensitivity | Drug Treatment | Interaction | ||||
|---|---|---|---|---|---|---|
| OD | Positive pixel area | OD Positive pixel area | OD | Positive pixel area | ||
| TPH2 | *p=0.0002 | *p=0.0003 | p=0.13 | p= 0.10 | p=0.37 | p=0.57 |
| SERT | *p=0.005 | *p=0.001 | p=0.27 | p= 0.22 | p=0.66 | p=0.98 |
| 5HT1A | *p=0.004 | *p=0.001 | p=0.89 | p= 0.83 | p=0.17 | p=0.072 |

