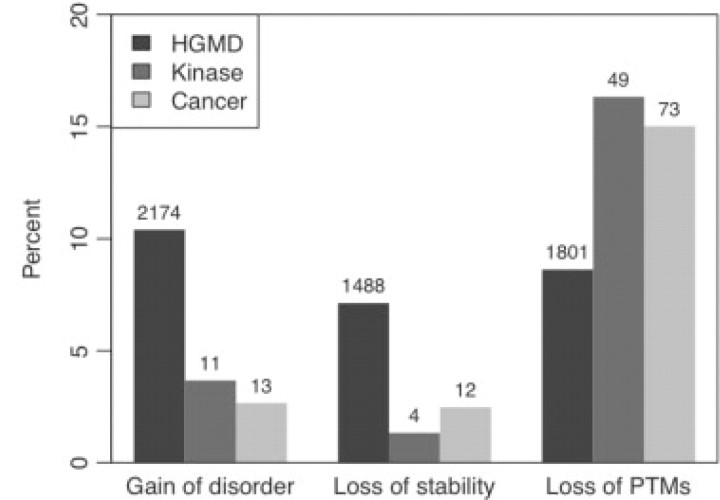
Fig. 3.
The percentage of actionable hypotheses on Hgmd, Kinase, and Cancer data sets. P-values are calculated between Hgmd versus Kinase and Hgmd versus Cancer: gain of disorder (3.4×10⁻⁹; 2.7 ×10⁻²²), loss of stability (1.0×10⁻¹⁵; 3.4×10⁻¹⁰), loss of post-translationally modified (PTM) target sites (3.8×10⁻⁴; 1.0×10⁻⁴).

