
Figure 3.
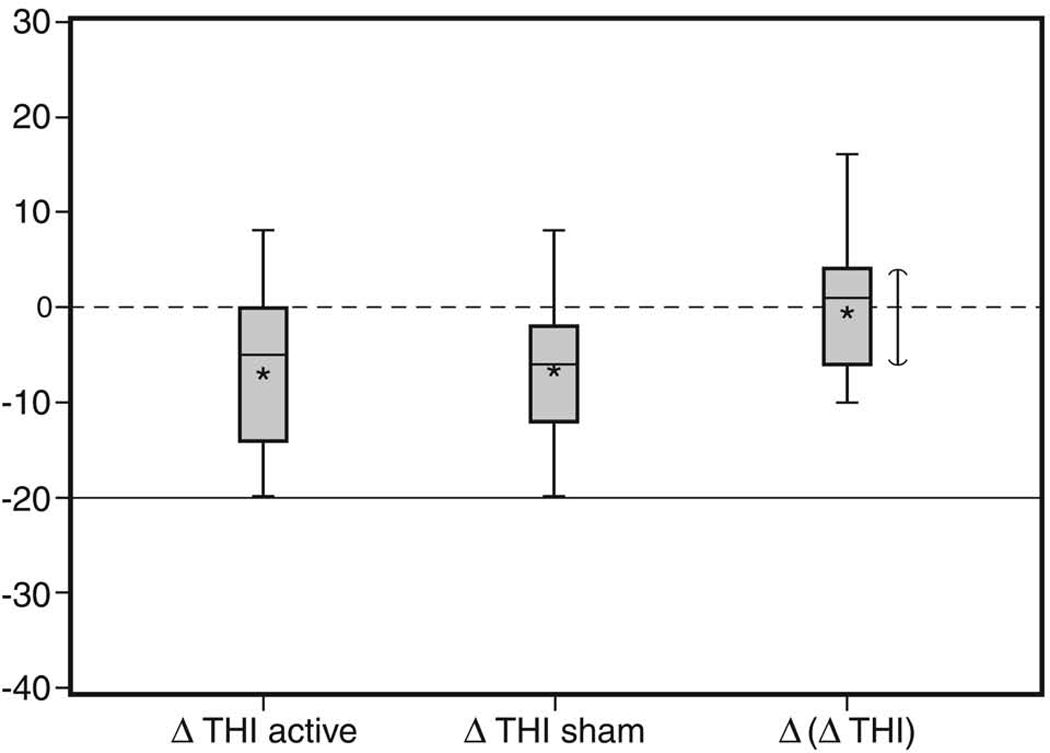
Box And Whisker Plot Of Change In THI Score
Footnote: Asterisks report mean, horizontal black line represents median, and upper and lower boundaries of box represent 75th and 25th percentile. Horizontal dash and solid lines represent statistical and clinical significant levels, respectively. Vertical line represents 95% confidence interval for the median.