
Figure 2.
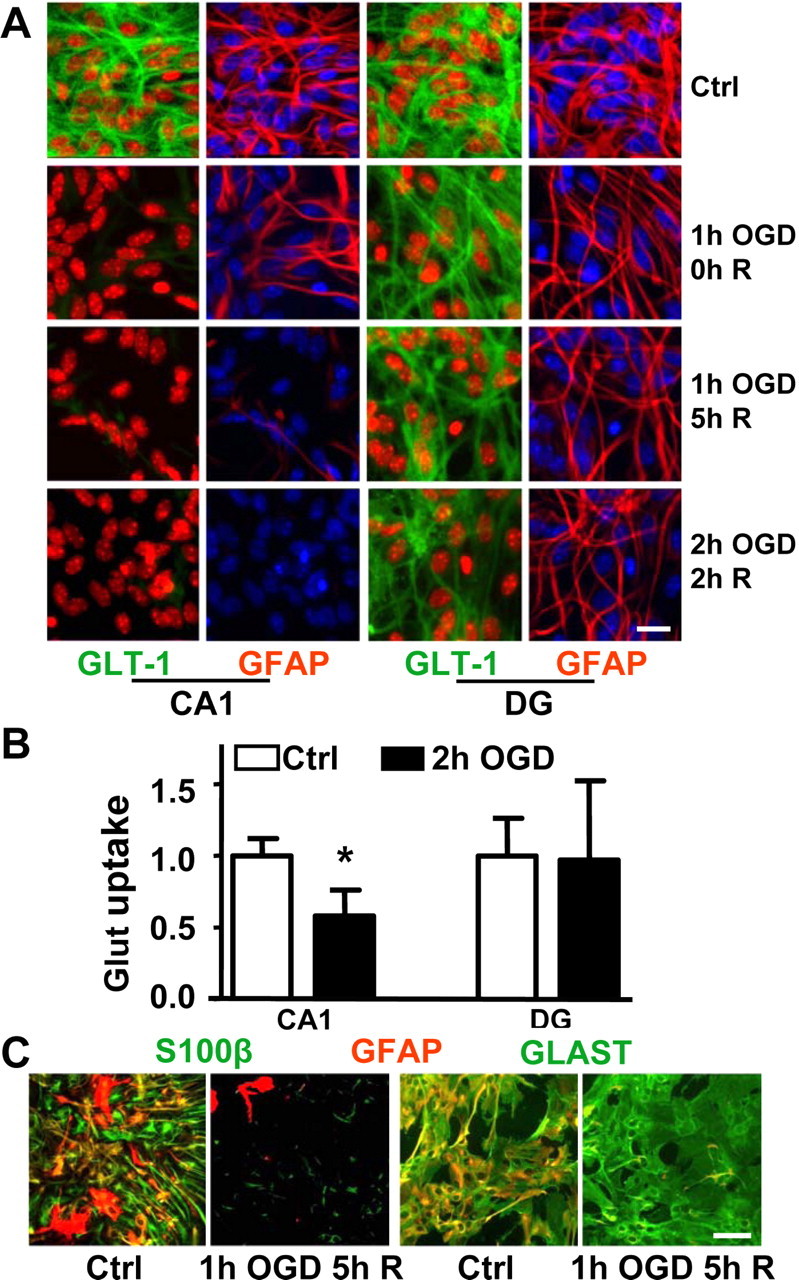
GFAP, GLT-1, S100β, and GLAST immunoreactivity and glutamate uptake in astrocytes from CA1 and DG hippocampal regions after OGD. A, Comparison of GFAP and GLT-1 immunostaining with different durations of OGD and recovery (R) time. Green, GLT-1; red, GFAP; blue, Hoechst for nuclei (for better contrast, the nuclei were pseudocolored red in the GLT-1 stained columns). Scale bar, 20 μm. B, Changes in glutamate (Glut) uptake activity in cultured astrocytes from hippocampal CA1 and DG regions after 2 h of OGD followed by 1 h of recovery. Values of glutamate uptake are a ratio to control and expressed as mean ± SD of three separate experiments, each performed in triplicate (*p < 0.05 compared with CA1 at 0 h time point). C, Comparison of GFAP, S100β (left two panels), and GLAST (right two panels) immunoreactivity at 5 h recovery (R) after 1 h OGD in astrocytes from the hippocampal CA1 region. Green, S100β and GLAST; red, GFAP; yellow, overlap. Scale bar, 60 μm. Ctrl, Control group.