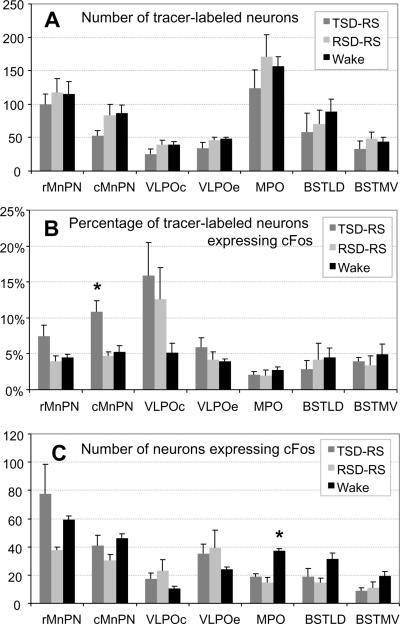
Figure 6.
(A) Mean (±SEM) Flurogold+ cell counts in the preoptic counting grids for TSD-RS (n=5), RSD-RS (n=5) and Awake (n=5) rats. (B) Mean (±SEM) values of the percentage of Flurogold+ neurons that were also immunopositive for c-Fos protein. (C) Mean (±SEM) of total number of neurons expressing c-Fos. VLPOe indicates combined data for the two extended VLPO boxes (see Figure 5).
* indicates significantly different from other groups (one-way ANOVA at p=0.05 level).

