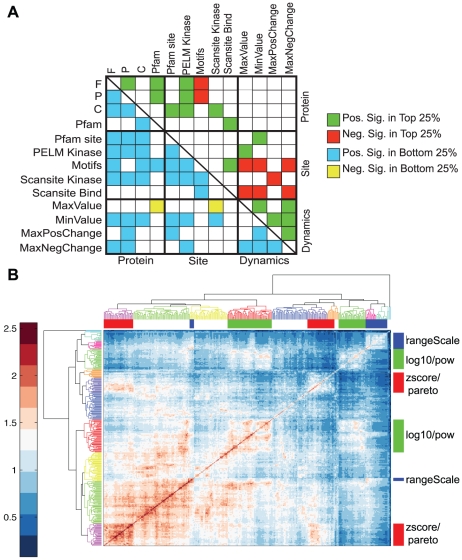
Figure 3. Comparison of parameters and metrics.
A) Pairwise comparison of the overlap in the best and worst 25% of sets based on each metric in  . We performed 1000 random selections of two sets of the same size to generate a normal distribution whose mean represents the expected overlap value between any two sets pulled from that background size. We then evaluated whether pairwise overlap was significantly higher (‘Pos. Sig’) or lower (‘Neg. Sig.’) than expected by random. Significance cutoff was set at a FDR corrected alpha value of 0.05. The top right represents the pairwise comparison of the best performing 25% and the bottom left is the comparison of the worst performing 25% of sets in each category. B) Hierarchical clustering of pairwise mutual information between every set in the MCA. Self-MI is highest along the diagonal. Highlighted groups indicate dendrogram cutoffs for which the full group is composed of the denoted parameter. The labels log10/pow denote normMax_log10, log10 and the pow transformations, pareto/zscore contain zscore and pareto transformations. The topmost zscore/pareto group contains one outlier (out of the group of 41) created using the transform pow.

