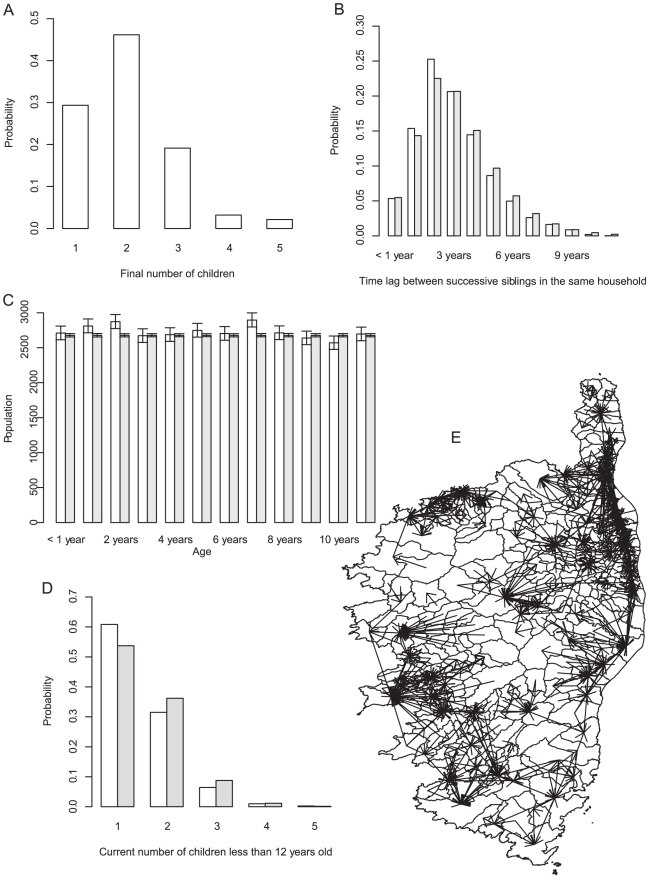
Figure 2. Simulation of a realistic children population in Corsica.
(A) Distribution of household final number of children. (B) Observed (white) and simulated (grey) distribution of time lag between successive siblings (in years). (C) Observed (white) and simulated (grey) number of children in Corsica according to age. (D) Observed (white) and simulated (grey) number of children aged less than 12 years old per household. (E) Commuting to school outside the municipality of residence.

