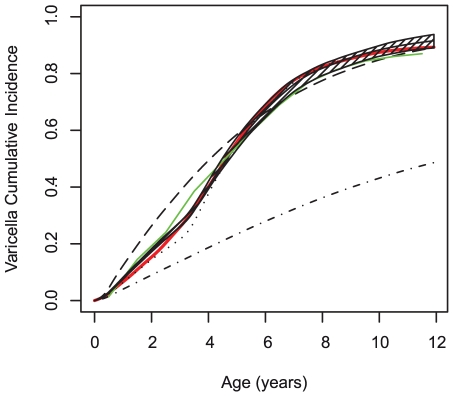
Figure 3. Observed and simulated cumulated incidence of varicella.
Observed cumulated incidence of varicella (red), simulated by the RAS model (green), and simulated allowing Households only (dashed dotted dark), Households and Municipalities (dashed dark), Households and Schools (dotted dark), Households and Schools and municipality (plain dark). Hatches correspond to the 95% CI of the “Households and Schools and Municipality” model.

