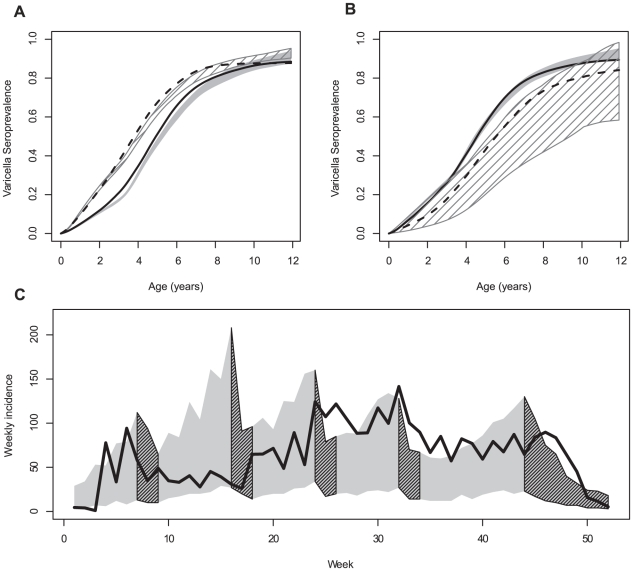
Figure 4. Best fitted model predictions: cumulated incidences and weekly incidence.
(A) Cumulated incidence in first-borns (observed: plain, simulated: grey zone) and others (observed: dashed, simulated: hatched zone). (B) Cumulated incidence in urban (observed: plain, simulated: grey zone) and rural municipalities (observed: dashed, simulated: hatched zone). (C) Observed weekly incidence (plain) and simulated (grey zone) starting from the first week of September to the end of August. Hatches correspond to school holidays. In all simulations, the maximum and minimum from over 100 years of simulation are reported.

