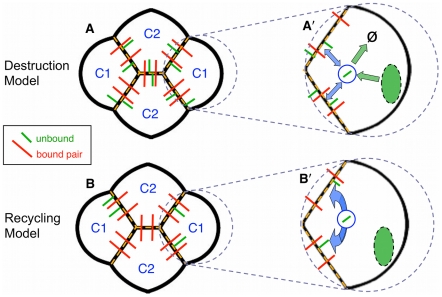
Figure 3. Destruction and Recycling models for N-cadherin distribution.
Cone cells with unpaired N-cadherin (green), or paired N-cadherin (red) along active interfaces (dashed orange). (A) Distribution and abundance of N-cadherin according to the Destruction Model. Green arrows in the inset A′ illustrate that N-cadherin molecules are continually and rapidly synthesized and destroyed (Ø). Blue arrows illustrate that unpaired N-cadherin traffics via endosomes (blue) to and from the cell surface. This results in a uniform coverage of active interfaces with an equilibrium distribution of unpaired and paired molecules. (B) Distribution and abundance of N-cadherin according to the Recycling Model. The rates of synthesis and destruction of N-cadherin are minor relative to trafficking of N-cadherin to and from the surface (B′). Transport of unpaired N-cadherin through endosomes allows continual redistribution of N-cadherin along the cell surface, so that unpaired molecules have multiple opportunities to find partners to pair with. The C2 cells, with the longest active edges, exhaust their unpaired N-cadherin supply. Unpaired molecules remain in the C1 cells.

