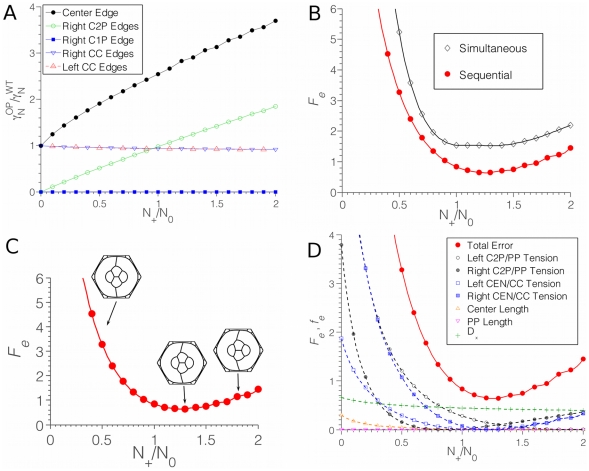
Figure 7. Analysis of misexpression simulations.
(A) Relative binding strengths on various interfaces as the N+/N0 ratio varies. Binding strength when N-cadherin misexpressed (OP) was normalized to the wildtype binding strength (WT). (B) Total error (values of the total error function Fe) as a function of the N+/N0 ratio. Red line describes error from simulation in which the transgene and endogenous gene begin expression sequentially. Black line describes simulation in which the two genes begin expression simultaneously. (C) The effect of changing N+/N0 on the shape of the ommatidium in the sequential simulation. For small N+/N0 (here shown for N+/N0 = 0.4 on the left), the asymmetry is weak; for large N+/N0 = 1.8 (right), the differences are more subtle, and the quantitation through Fe is necessary. (D) Total error is dominated by contributions fe from the tension ratios of cone/cone cell edges and C2/P cell edges, with significant contributions from the asymmetry parameter D x.

