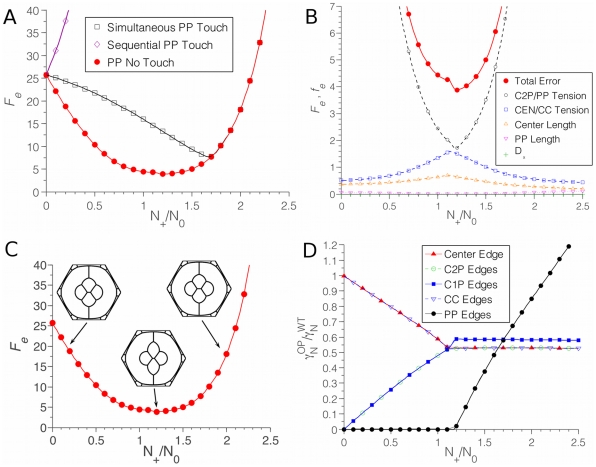
Figure 9. Analysis of P cell misexpression simulations.
(A) Total error Fe for different simulations as a function of N+/N0. The red line describes the simulation error when P cells express N-cadherin before cone cells, and P cells do not contact each other until after the onset of N-cadherin expression in cone cells. The purple line describes simulation error when P cells express N-cadherin before cone cells but P cells are always in contact with each other. The black line describes simulation error when P cells and cone cells simultaneously begin N-cadherin expression, and P cells always are in contact with each other. (B) Error contributions to the best-fit model are dominated by the same fe terms as in the other misexpression simulation, except that the symmetric structure of this mutant has no D x contribution to the error. The minimum is located at N+/N0≈1.2. (C) The effect of N+/N0 on the shape of the ommatidium, with only values near the error function minimum approximating the observed cruciform mutant shape. (D) Binding strengths of N-cadherin on various edges of the structure as N+/N0 varies. Note the absence of binding on PP edges for N+/N0<1.2.

