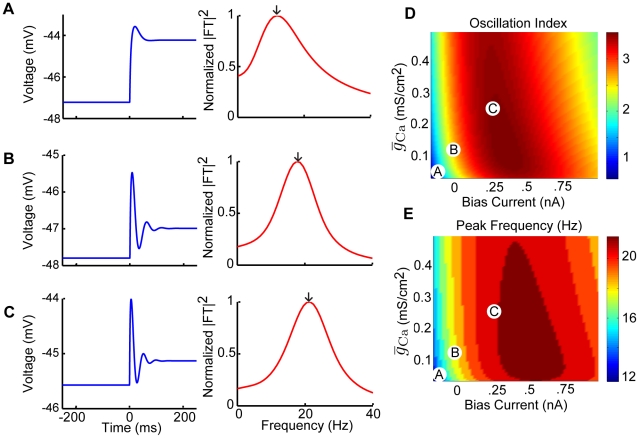
Figure 2. The model displays damped membrane potential oscillations in response to step current input.
The model's membrane potential response to step current input was characterized for a physiologically plausible range of bias current and calcium conductance values. A–C) Example membrane voltage responses and the normalized squared magnitude of their Fourier transforms. These correspond to parameter values as follows: A)  ,
,  , B)
, B)  ,
,  , and C)
  ,
,  . D) Oscillation index (see Methods) measuring the strength of the oscillation in the subthreshold response as a function of
  and
and  . E) The peak frequency component of the squared magnitude of the responsesÕ Fourier transforms as a function of
  and
and  . The parameter values corresponding to panels A,B,C are also shown. Other parameter values were:
  ,
,  , and
, and  .
.

