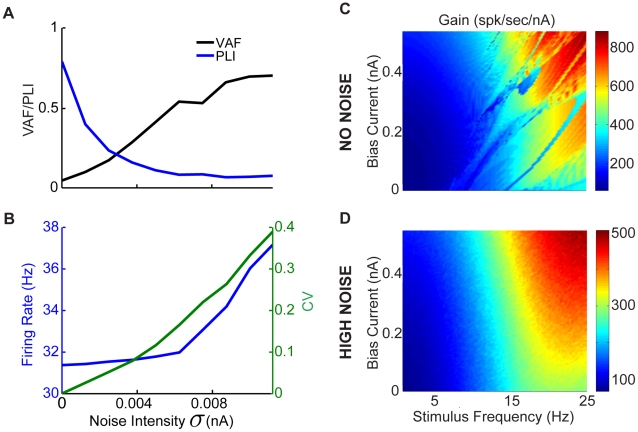
Figure 10. Effects of varying noise intensity on the VAF and PLI.
A) Increasing noise intensity results in decreased PLI and consequently increased VAF values for  and
and  . B) Increasing noise intensity also results in increased resting (ie
  ) discharge rate as well as increased spiking variability as quantified by CV. C) Gain obtained from our model with no noise (
 ) as a function of
  and
and  . D) Gain obtained from our model with high noise intensity (
 ) as a function of
  and
and  . It is seen that for a given value of
  the gain increases as a function of the input frequency
  until about 22 Hz.

