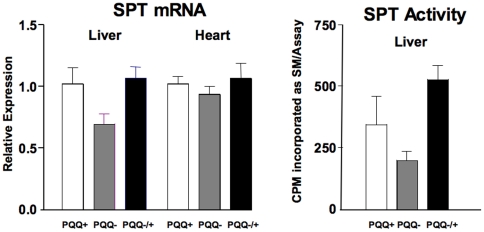
Figure 3. Serine palmityl transferase (SPT) mRNA expression in liver and heart and SPT functional activity levels in liver.
Values are the means ± SEM (n = 5 per group). Although variable, rats fed PQQ− diets tended (p∼0.2–0.3) to have lower values for mRNA expression and activity (see Discussion).

