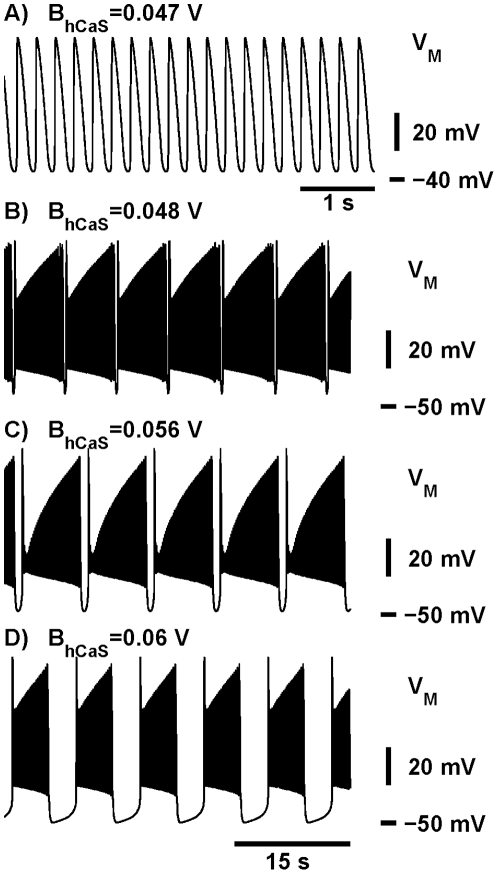
Figure 2. Transition from tonic spiking into bursting and the evolution of the bursting waveforms.
The increase of the half-inactivation voltage of the slow calcium current,  shifts
  towards more hyperpolarized values of
  changing the activity from tonic spiking (A) to bursting (B–D). (A) For
  = 0.047 V the model exhibits a periodic tonic spiking activity. (B–D) The increase of
  up to 0.048 V shifts
  towards the hyperpolarized value of
  thus changing the activity from tonic spiking to bursting. (C) The increase of
  to 0.056 V expands the interburst interval. (D)
  = 0.06 V brings the value of the interburst interval close to the targeted value. The leak current parameters are the same as in Fig. 1.
  was 0.031 V for A and D. Panels (B)–(D) have the same time scale.

