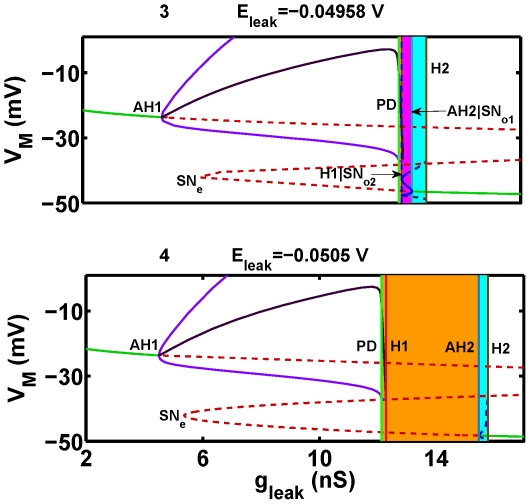
Figure 8. The one-parameter ( ) bifurcation diagrams corresponding to levels 3 and 4 in Figure 5.
The diagrams show the evolution of equilibria and oscillatory regimes for two values of the leak reversal potential:  (3) and
  (4) plotted against the bifurcation parameter
  . Labeling is the same as in Fig. 7. Numbers 3 and 4 correspond to the dashed lines 3 and 4 in Fig. 5. Here, the blue rectangles determine the range of bistability of the bursting and hyperpolarized equilibrium. In (3) the pink rectangle marks the range of the coexistence of bursting and the stable subthreshold oscillations. The critical values for the Andronov-Hopf bifurcation (AH2) and the saddle-node bifurcation
  are very close to each other and marked by the single vertical line AH2
 .
.

