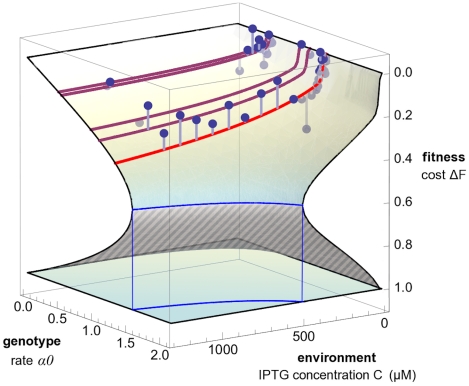
Figure 5. Genotype-environment-fitness map.
The fitness cost  of the lac pathway is shown as a function of the operator genotype summary variable
  (maximum rate of protein production at a growth of 1 cell division/hr, see text) and the external inducer concentration
  . The model fitness landscape is again strongly nonlinear: it has a stable upper branch (solid shading) and an unstable lower branch (striped shading) separated by a fitness cliff (blue line), similar to the phenotype-fitness map of Figure 4. Model predictions for individual strains under varying inducer concentrations are shown as a family of red lines (light red: wild type; dark red: operator mutant strains with
  equal to wild type value, see text). Experimental fitness values are shown as dots (the offset from the model surface is marked by gray lines).

