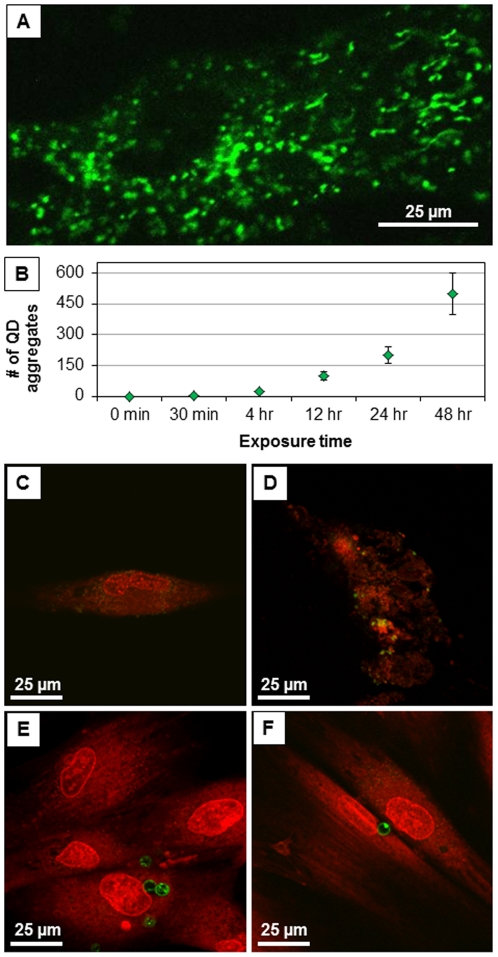
Figure 4. QD association and cellular morphology.
(A) QD accumulation in HDF mitochondria (Confocal, 60×, Zeiss). (B) The number of QD aggregates accumulating in HDF increases over time. Fluorescence images of cells dosed with QDs at the (C) 12 hr and (D) 48 hr time points. Images of cells dosed with QDMCs (at an equivalent amount of Cd+2 ions relative to QDs) at the (E) 12 hr and (F) 48 hr time points. Microcapsules are resting on top of cells, but do not enter cells. Cells dosed with an equivalent Cd atom concentration of the QD-loaded microcapsules displayed no evidence of particle uptake and remained viable with no sign of deterioration through the 48 hr time point.

