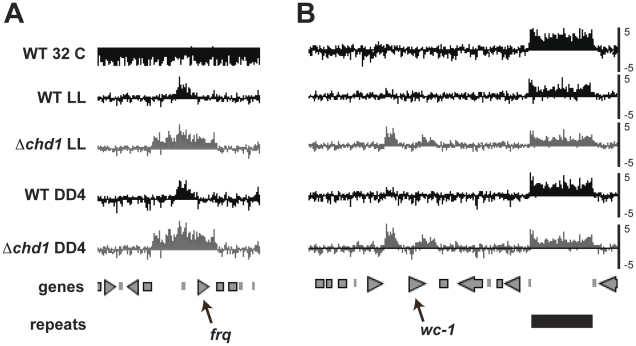
Figure 5. DNA methylation at frq and wc-1.
Enrichment values for MeDIP experiments are shown at frq and wc-1 loci as log2 values (right). MeDIP data for WT and Δchd1 strains grown in constant light (LL) or for four hours in the dark (DD4) are shown below a plot of previously published MeDIP data obtained from WT grown at 32 degrees (WT 32) [45]. The positions of predicted genes are shown in grey and an annotated repeat near wc-1 is shown in black; frq and wc-1 are indicated.

