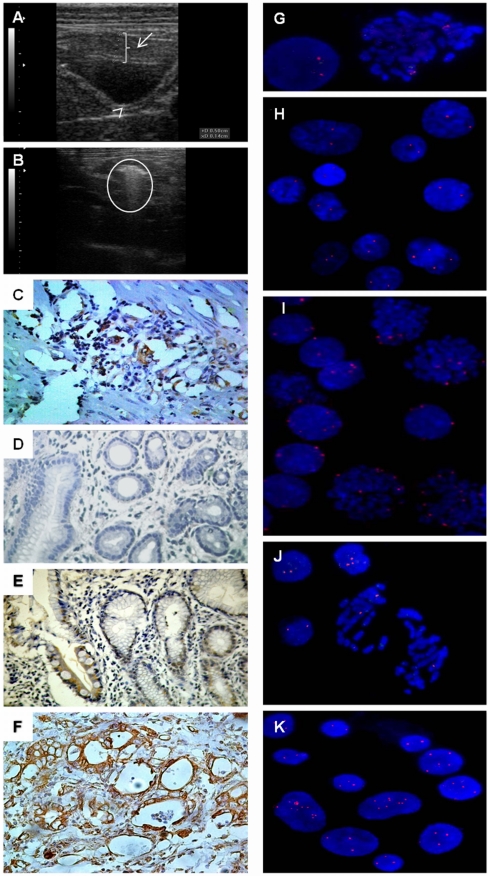
Figure 1. Ultrasonography, immunohistochemistry and FISH analysis in C. apella gastric carcinogenesis models.
A) ultrasound image showing a “space” between the stomach wall where ACP03 cell line was inoculated and developed a tumor (2.5 cm); B) ultrasound image showing a tumor mass in a MNU-treated animal on the 940th day (5 cm); C); MYC immunoreactivity in a tumor sample of a CLCA1 animal (400×); D); lack of MYC immunoreactivity in non-atrophic gastritis sample in a MNU-treated animal (400×); E) MYC immunoreactivity in intestinal metaplasia sample of a MNU-treated animal (400×); F) MYC immunoreactivity in a tumor sample of a MNU-treated animal (400×); G) lymphocytes of a healthy C. apella showing two signals for MYC probe (1000×); H) normal gastric mucosa cells of NC animal presenting two MYC signals (1000×); I) neoplastic gastric mucosa of CL animal showing MYC amplification (1000×); J) intestinal metaplasia sample of MNU-treated animal presenting 1, 2 and 3 MYC signals (1000×); K) tumor sample of MNU-treated animal showing MYC amplification (1000×). Arrow indicates the space with gastric cancer cell line; arrowhead indicates a normal gastric wall thickness; circle indicates the proliferative process.

