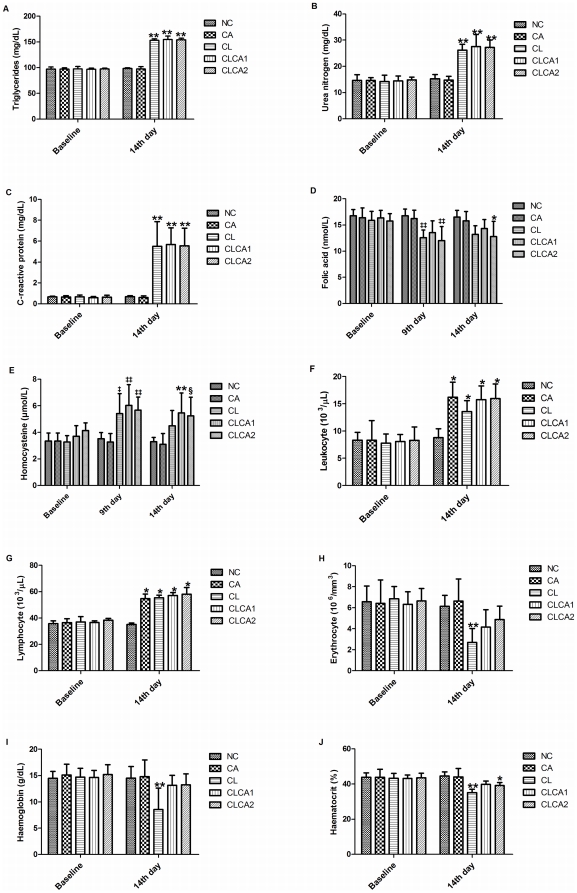
Figure 2. Abnormal biochemical and hematologic measurements in animals of the first carcinogenesis model.
A) triglycerides; B) urea nitrogen; C) C-reactive protein; D) leukocyte; E) lymphocyte; F) erythrocyte; G) haemoglobin; H) haematocrit; I) folic acid; J) homocysteine. NC: negative control; CA: Canova group; CL: animals inoculated with ACP03 cell line; CLCA1: animals inoculated with ACP03 cell line and treated with Canova during 10 days; CLCA2: animals inoculated with ACP03 cell line and treated with Canova during 14 days. N = 6/group. * Significantly different from NC group (p<0.05) on the 14th day. ** Significantly different from NC and CA groups (p<0.05) on the 14th day. § Significantly different from NC group (p<0.05) on the 14th day. ‡ Significantly different from CA group (p<0.05) on the 9th day. ‡‡ Significantly different from NC and CA groups (p<0.05) on the 9th day.

