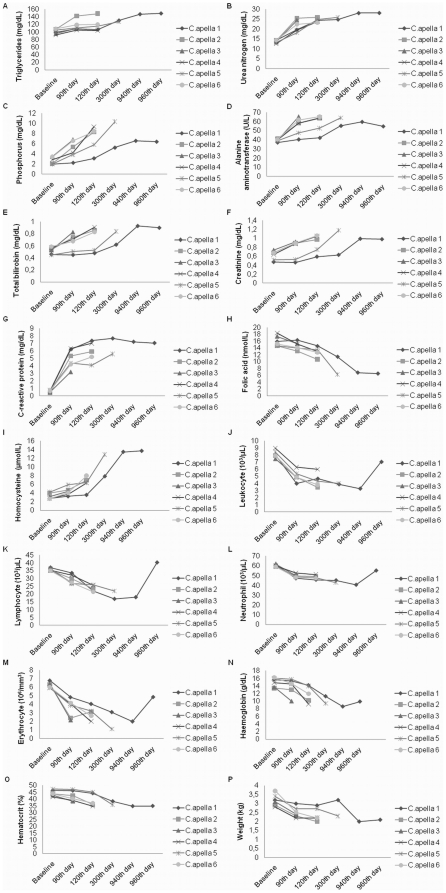
Figure 3. Abnormal biochemical and hematologic measurements in animals MNU-treated and Canova-treated.
A) triglycerides; B) urea nitrogen; C) phosphorus; D) alanine aminotransferase; E) total bilirubin; F) creatinine; G) C-reactive protein; H) leukocyte; I) lymphocyte; J) neutrophil; K) erythrocyte; L) haemoglobin; M) haematocrit; N) folic acid; O) homocysteine; P) weight. N = 6 on the 0–90th days (non-atrophic gastritis); N = 5 on the 120th day (atrophic gastritis); N = 2 on the 300th day (intestinal metaplasia); N = 1 on the 940th (gastric cancer development) and 960th (Canova treatment effect).

