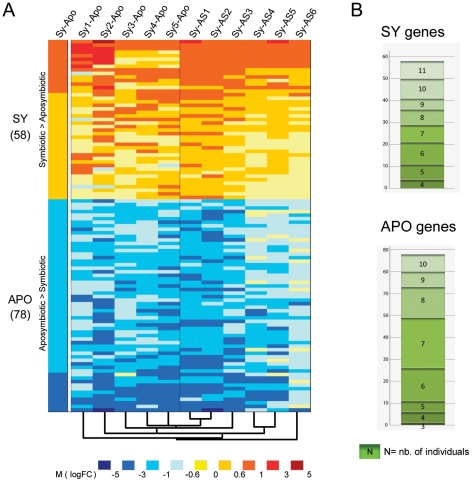
Figure 2. Differentially expressed genes (DEG) between symbiotic and aposymbiotic anemones.
A. Heatmap diagram of DEG. Left column (Sy-Apo) represents expression of the 58 up- (SY) and 78 down-regulated (APO) genes (|M|>0.59, B>0) identified from the batch comparison of the 5 pooled symbiotic versus the 6 pooled aposymbiotic anemones. The following columns to the right represent expression of the same genes in each individual symbiotic anemone (Sy1–5) compared with the pooled aposymbiotic (-Apo) anemones and in each individual aposymbiotic anemone (AS1–6) compared with the pooled symbiotic (-Sy) anemones. The dendogram underneath the heatmap represents the cluster array tree result performed on the entire result dataset (with Cluster3). The color intensity code representing M value intervals is shown below. B. A given gene can be differentially expressed in the batch analysis (SY or APO) although only differentially expressed in few individual sea anemones. Histogram shows the number of individual anemones (3–11) each gene is differentially expressed in. Top and bottom panels: gene distribution of SY and APO genes, respectively.

