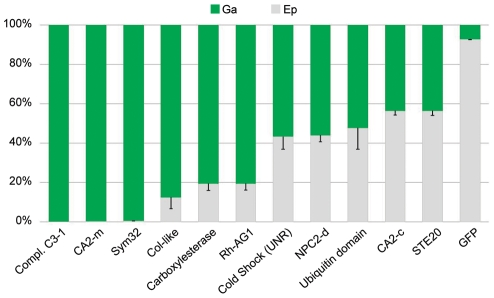
Figure 5. Tissue-specific expression of targeted genes.
RT-qPCRs were performed on the epidermal (Ep) and gastrodermal (Ga) total RNA extracts from 3 different sea anemones. The histogram shows the relative Ep (gray) versus Ga (green) expression of the genes listed on the histogram (error bars represent standard error).

