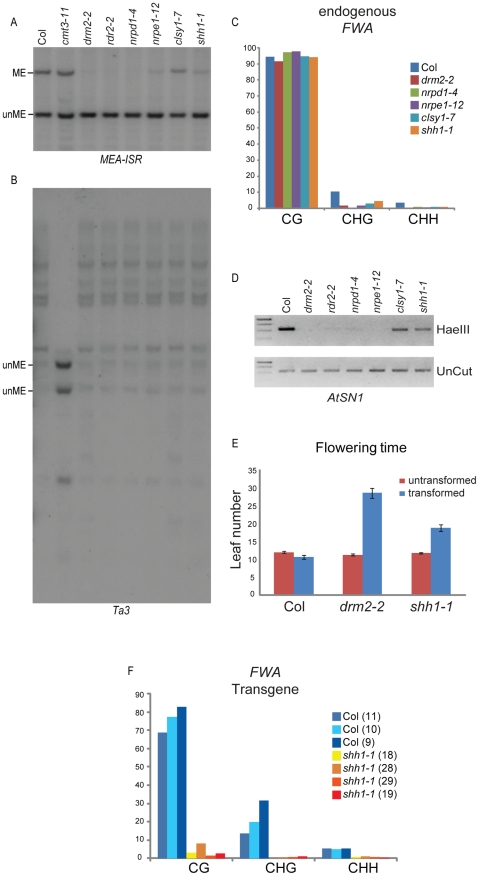
Figure 3. Characterization of methylation defects in the shh1 mutant.
Assessment of DNA methylation levels at the (A) MEA-ISR and (B) Ta3 loci by Southern blotting using Msp I digested genomic DNA extracted from the genotypes indicated above each lane and a locus-specific radiolabeled probe. ME; methylated DNA, unME; unmethylated DNA. (C) Assessment of the levels of DNA methylation at the endogenous FWA locus by bisulfite sequencing. The y axis is the percent of methylation and the x-axis is the context of methylation. (D) Assessment of the level of DNA methylation at the AtSN1 locus using a methyl-cutting assay in which genomic DNA extracted from the indicated genotypes was either untreated (unCut) or digested with the methylation sensitive Hae III enzyme prior to amplification of the AtSN1 locus. (E and F) Assessment of the role of SHH1 in de novo DNA methylation by flowering time (E) and bisulfite sequencing (F). In (E), the graph shows the leaf number (y axis) of individual T1 plants of the indicated genotype (x axis) either untransformed or transformed with a transgene carrying the FWA gene. The black bars represent standard error. In (F), T2 tissue from individual Col or shh1 T1 transformants was used to assess the level of DNA methylation on the FWA transgene. The y axis is the percent of methylation observed and the x-axis is the context of methylation. The number in parentheses next to the plant genotype indicates the flowering time of the T1 parent.

