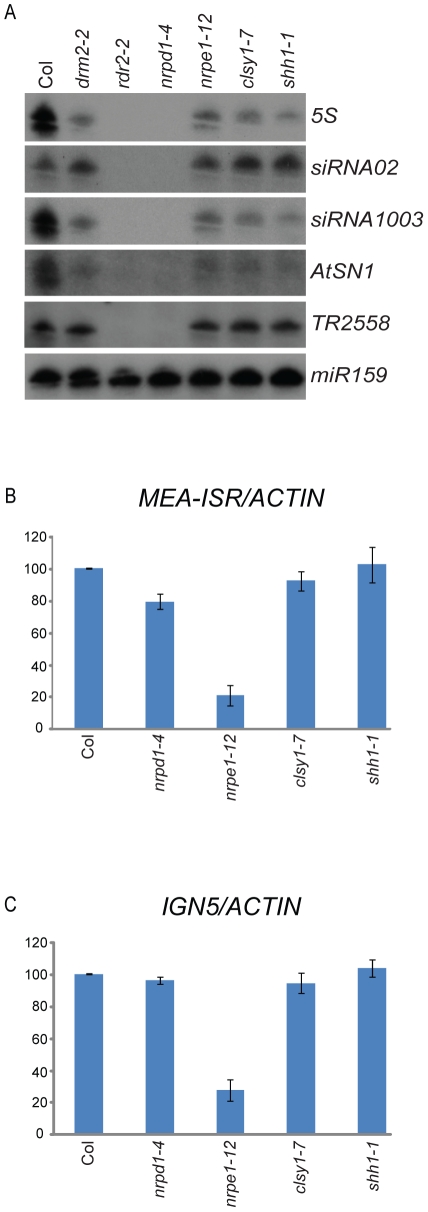
Figure 4. Characterization of siRNAs and Pol-V dependent transcripts in the shh1 mutant.
(A) Assessment of siRNA levels at the indicated loci (right) by northern blotting using RNA extracted from the genotypes indicated above. (B–C) Assessment of Pol-V dependent transcript levels (y axis) using RNA isolated from the genotypes indicated (x axis) relative to ACTIN and normalized to Col at the MEA-ISR and IGN5 loci. Thick blue bars represent the average of three biological replicates and thin black bars are the standard error of the three experiments.

