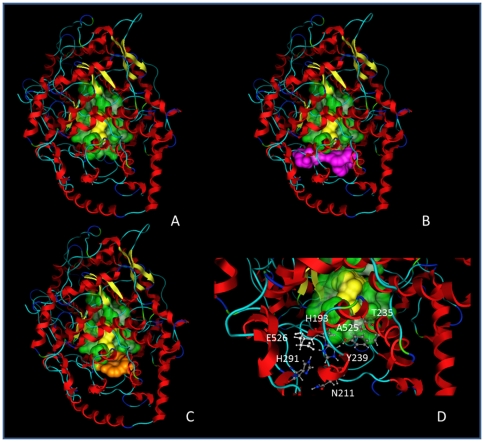
Figure 1. SceOSC and mutant models.
A) SceOSC active site (in green) and lanosterol location (in yellow) as deduced from HsaOSC crystallographic data (1W6K). B) Aas involved in the channel constriction (in pink) as suggested by SHC-based considerations. C) Aas involved in the channel constriction (in orange) as suggested HsaOSC-based considerations. D) Mutated residues studied in this work (together with Glu526 shown for comparison).

