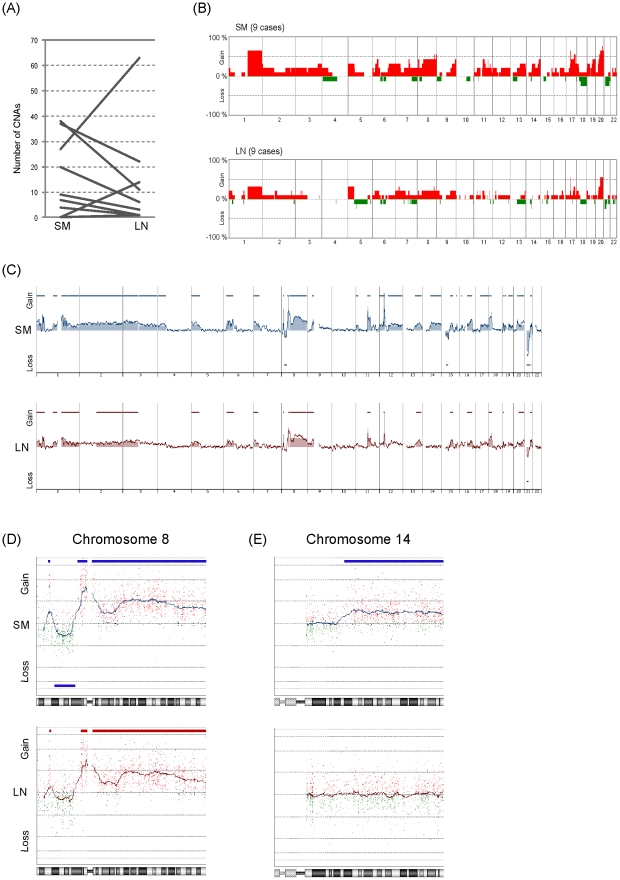
Figure 4. Comparison of CNAs between the paired SM and LN portions.
(A) Comparison of the number of CNAs in the SM and LN portions. For this analysis, samples indicated by ‘c’ and ‘d’ in Table 1 were used. (B) Genome-wide frequencies of CNAs in the SM and corresponding paired LN in 9 cases. Horizontal lines: oligonucleotide probes are shown in order from chromosomes 1 to 22. Within each chromosome, clones are shown in order from the p telomere to the q telomere. Vertical lines: frequency (%) of gains (positive axis) and losses (negative axis) are shown for each probe. (C, D and E) Representative genomic profile of the SM and LN portions of SMGC. Whole genomic profiles of paired SM (above) and LN (below) portions from case 9 are shown in (C). Detailed genomic profiles of Chr8 and Chr14 are shown in (D) and (E), respectively. Horizontal lines above the center represent regions of gain, and those below the center represent regions of loss. Both SM and LN show similar genomic patterns in chromosome 8 (D). However, gain of chromosome 14q is detected only in the SM portion (E).

