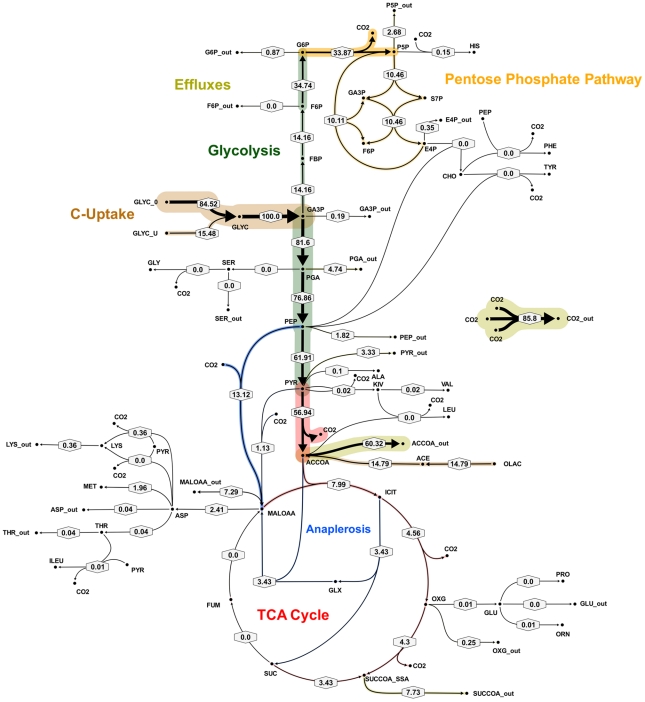
Figure 8. Metabolic flux map corresponding to solution A for M. tuberculosis in glycerol limited continuous culture at slow growth rate (td = 69 h).
Flux values were normalized to the specific glycerol uptake rate which was arbitrarily given the value of 100. Both of the presented flux maps are able to describe the 13C labeling profiles of proteinogenic amino acids and measured extracellular flux values from steady state cultures of M. tuberculosis at slow growth rate. Arrows are pointing in the net flux direction and the width of each line is proportional to the underlying flux value. Numerical values of estimated fluxes (Table S5) are indicated on each flux arrow. The abbreviations are as in Figure 4.

